Misleading charts
Let’s start with the worst of crimes in data visualisation: presenting data in a misleading way. We never do this on purpose! But it does happen every now and then. Let’s look at the three examples from our archive.
Mistake: Truncating the scale
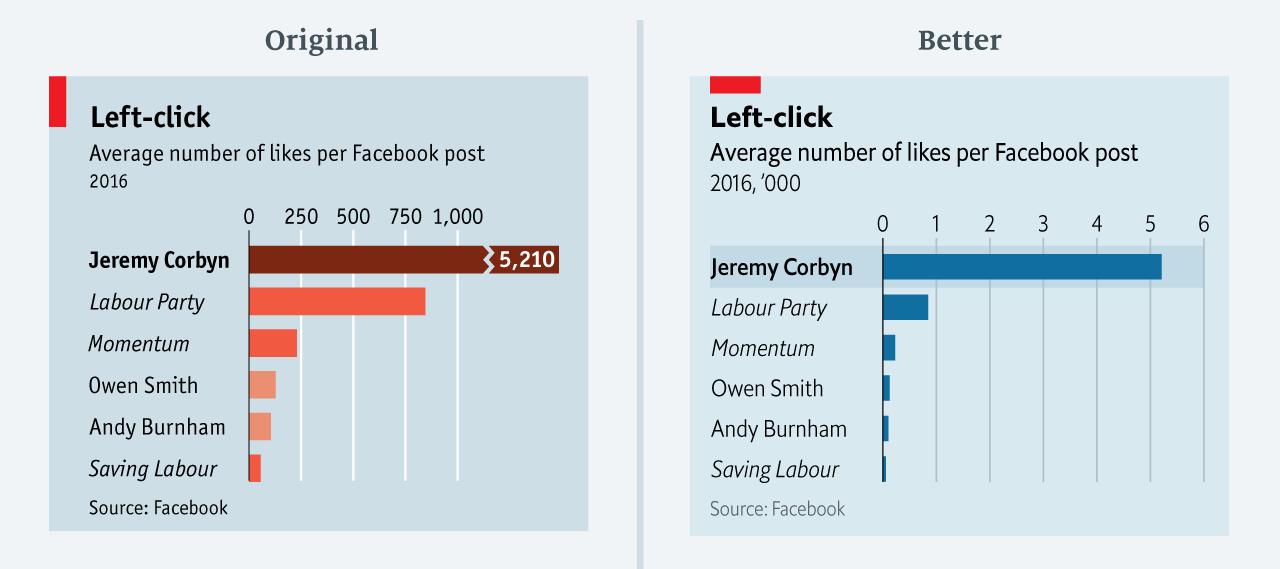
This chart shows the average number of Facebook likes on posts by pages of the political left. The point of this chart was to show the disparity between Mr Corbyn’s posts and others.
The original chart not only downplays the number of Mr Corbyn’s likes but also exaggerates those on other posts. In the redesigned version, we show Mr Corbyn’s bar in its entirety. All other bars remain visible. (Avid followers of this blog will have seen another example of this bad practice.)
Another odd thing is the choice of colour. In an attempt to emulate Labour’s colour scheme, we used three shades of orange/red to distinguish between Jeremy Corbyn, other MPs and parties/groups. We don’t explain this. While the logic behind the colours might be obvious to a lot of readers, it perhaps makes little sense for those less familiar with British politics.
Mistake: Forcing a relationship by cherry-picking scales
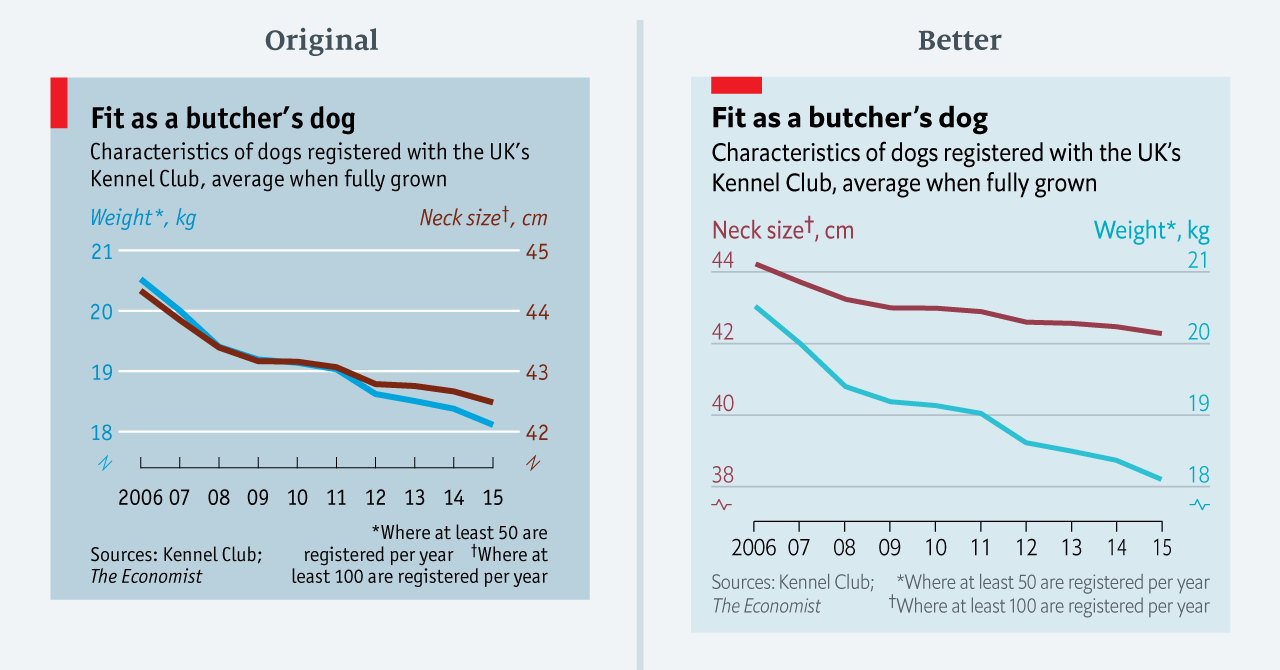
The chart above accompanied a story on the decline of dog weights. On first glance, it appears that the weight and neck sizes of dogs are perfectly correlated. But is this true? Only to some extent.
In the original chart, both scales decrease by three units (from 21 to 18 on the left; from 45 to 42 on the right). In percentage terms, the left scale decreases by 14% while the right goes down by 7%. In the redesigned chart, I retained the double scale but adjusted their ranges to reflect a comparable proportional change.
Considering the jolly topic of this chart, this mistake may seem relatively minor. The message of the chart, after all, is the same in both versions. But the takeaway is important: if two series follow each other too closely, it is probably a good idea to have a closer look at the scales.
Mistake: Choosing the wrong visualisation method
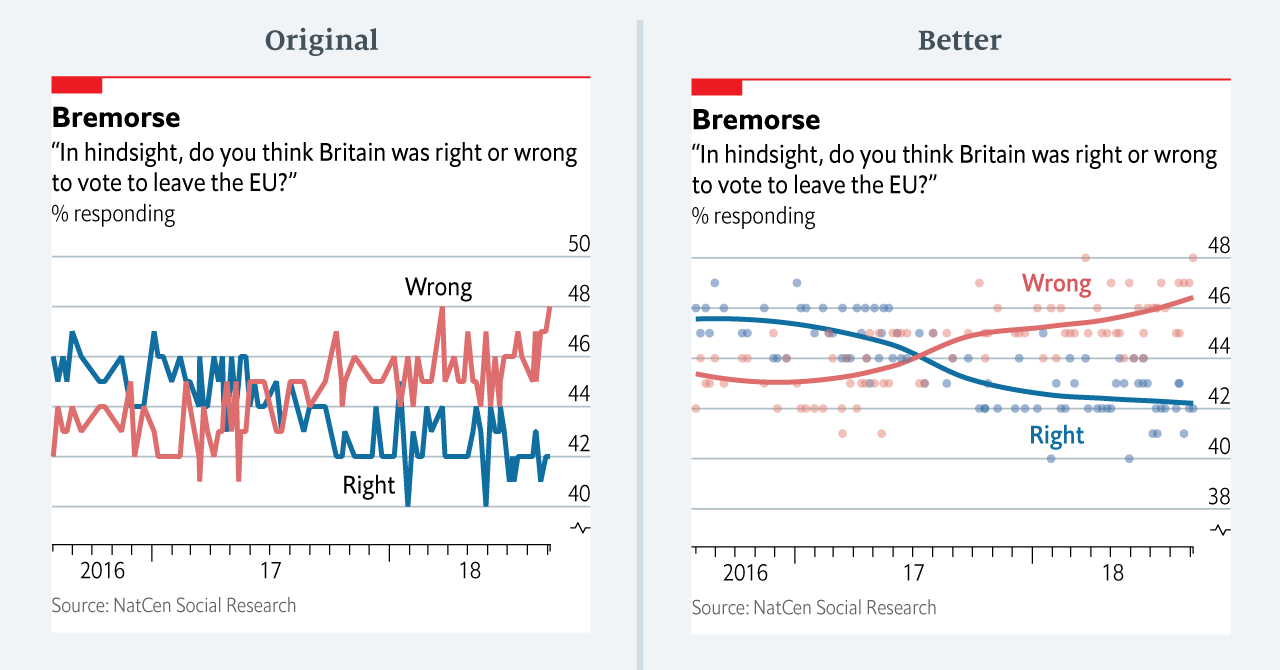
We published this polling chart in Espresso, our daily news app. It shows attitudes to the outcome of the EU referendum, plotted as a line chart. Looking at the data, it appears as if respondents had a rather erratic view of the referendum result — increasing and decreasing by a couple of percentage points from one week to the next.
Instead of plotting the individual polls with a smoothed curve to show the trend, we connected the actual values of each individual poll. This happened, primarily, because our in-house charting tool does not plot smoothed lines. Until fairly recently, we were less comfortable with statistical software (like R) that allows more sophisticated visualisations. Today, all of us are able to plot a polling chart like the redesigned one above.
Another thing to note in this chart is the way in which the scale was broken. The original chart spreads the data wider than it should. In the redesigned version, I have left some more space between the start of the scale and the smallest data point. Francis Gagnon has put together a nice formula for this: aim for leaving at least 20% of the plot area free under a line chart that doesn’t start at zero.
