In the last two posts, Kubernetes-based Microservice Observability with Istio Service Mesh and Azure Kubernetes Service (AKS) Observability with Istio Service Mesh, we explored the observability tools which are included with Istio Service Mesh. These tools currently include Prometheus and Grafana for metric collection, monitoring, and alerting, Jaeger for distributed tracing, and Kiali for Istio service-mesh-based microservice visualization and monitoring. Combined with cloud platform-native monitoring and logging services, such as Stackdriver on GCP, CloudWatch on AWS, Azure Monitor logs on Azure, and we have a complete observability solution for modern, distributed, Cloud-based applications.
In this post, we will examine the use of Istio’s observability tools to monitor Go-based microservices that use Protocol Buffers (aka Protobuf) over gRPC (gRPC Remote Procedure Calls) and HTTP/2 for client-server communications, as opposed to the more traditional, REST-based JSON (JavaScript Object Notation) over HTTP (Hypertext Transfer Protocol). We will see how Kubernetes, Istio, Envoy, and the observability tools work seamlessly with gRPC, just as they do with JSON over HTTP, on Google Kubernetes Engine (GKE).
Technologies
gRPC
According to the gRPC project, gRPC, a CNCF incubating project, is a modern, high-performance, open-source and universal remote procedure call (RPC) framework that can run anywhere. It enables client and server applications to communicate transparently and makes it easier to build connected systems. Google, the original developer of gRPC, has used the underlying technologies and concepts in gRPC for years. The current implementation is used in several Google cloud products and Google externally facing APIs. It is also being used by Square, Netflix, CoreOS, Docker, CockroachDB, Cisco, Juniper Networks and many other organizations.
Protocol Buffers
By default, gRPC uses Protocol Buffers. According to Google, protocol buffers are a language- and platform-neutral, efficient, extensible, automated mechanism for serializing structured data for use in communications protocols, data storage, and more. Protocol Buffers are 3 to 10 times smaller and 20 to 100 times faster than XML. Compiling source protocol buffers .proto file using generate data access classes that are easier to use programmatically.
Protocol Buffers are 3 to 10 times smaller and 20 to 100 times faster than XML.
Protocol buffers currently support generated code in Java, Python, Objective-C, and C++, Dart, Go, Ruby, and C#. For this post, we have compiled for Go. You can read more about the binary wire format of Protobuf on Google’s Developers Portal.
Envoy Proxy
According to the Istio project, Istio uses an extended version of the Envoy proxy. Envoy is deployed as a sidecar to a relevant service in the same Kubernetes pod. Envoy, created by Lyft, is a high-performance proxy developed in C++ to mediate all inbound and outbound traffic for all services in the service mesh. Istio leverages Envoy’s many built-in features, including dynamic service discovery, load balancing, TLS termination, HTTP/2 and gRPC proxies, circuit-breakers, health checks, staged rollouts, fault injection, and rich metrics.
According to the post by Harvey Tuch of Google, Evolving a Protocol Buffer canonical API, Envoy proxy adopted Protocol Buffers, specifically proto3, as the canonical specification of for version 2 of Lyft’s gRPC-first API.
Reference Microservices Platform
In the last two posts, we explored Istio’s observability tools, using a RESTful microservices-based API platform written in Go and using JSON over HTTP for service to service communications. The API platform was comprised of eight Go-based microservices and one sample Angular 7, TypeScript-based front-end web client. The various services are dependent on MongoDB, and RabbitMQ for event queue-based communications. Below, the is JSON over HTTP-based platform architecture.
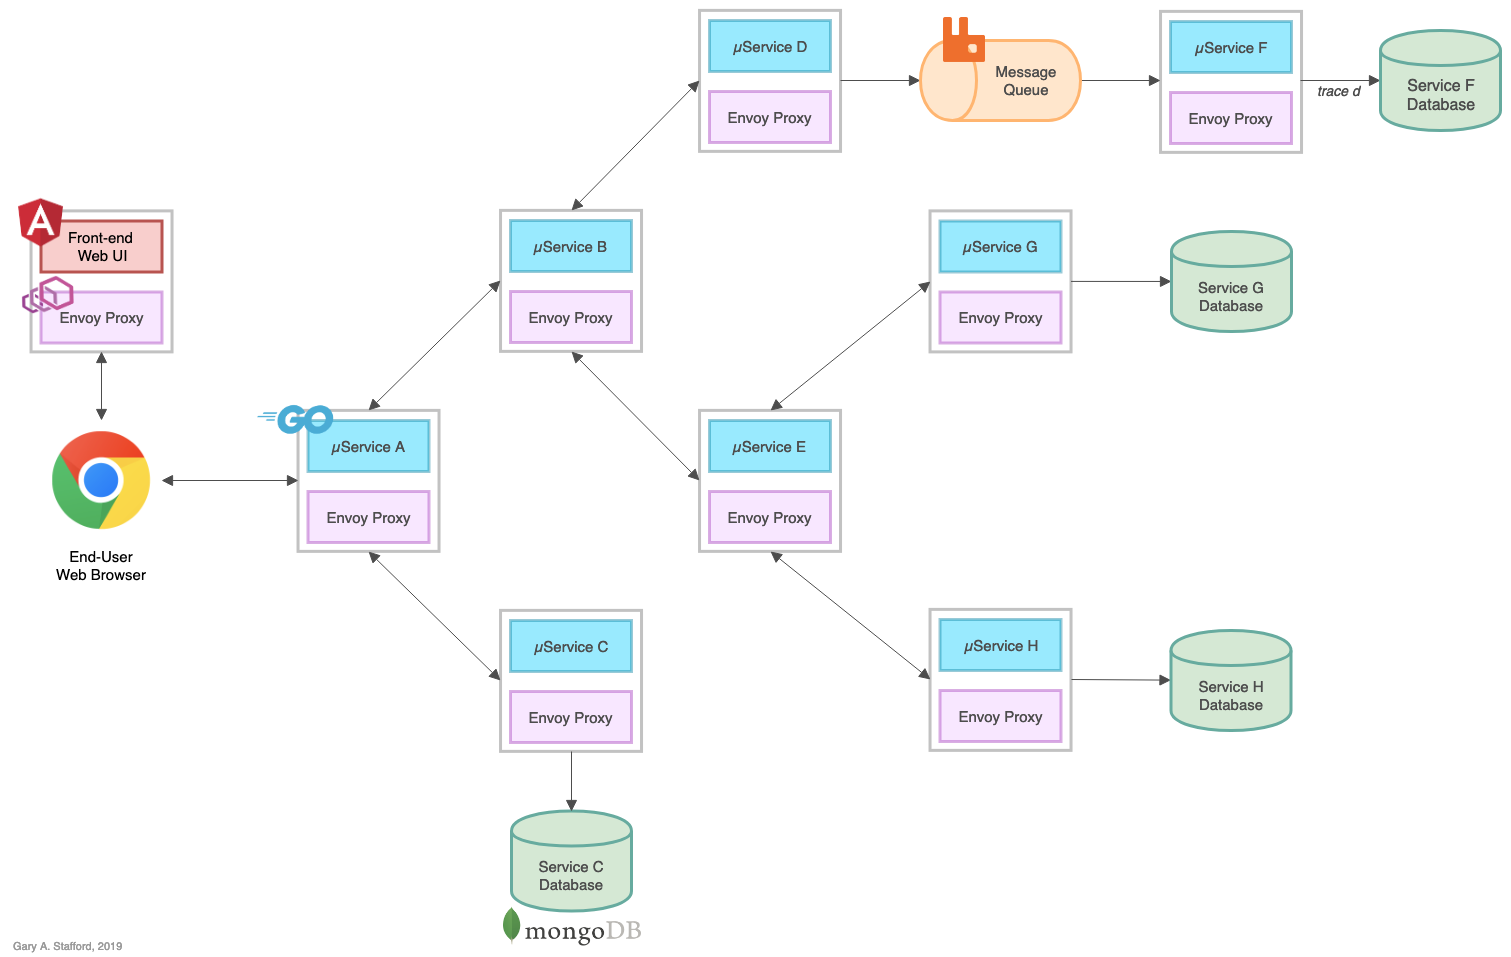
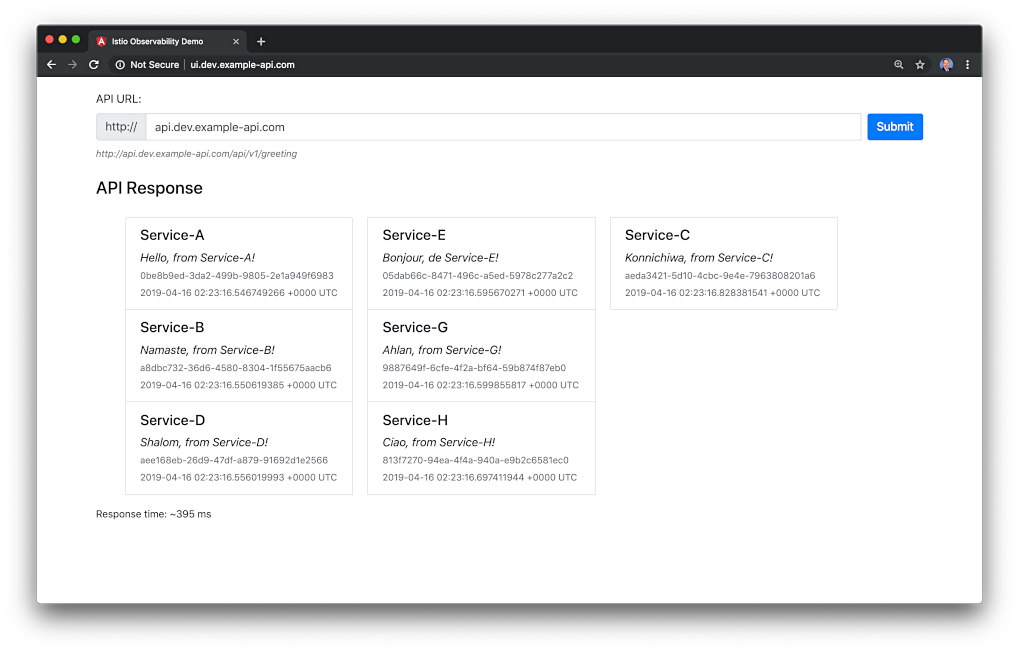
Below, the current Angular 7-based web client interface.
Converting to gRPC and Protocol Buffers
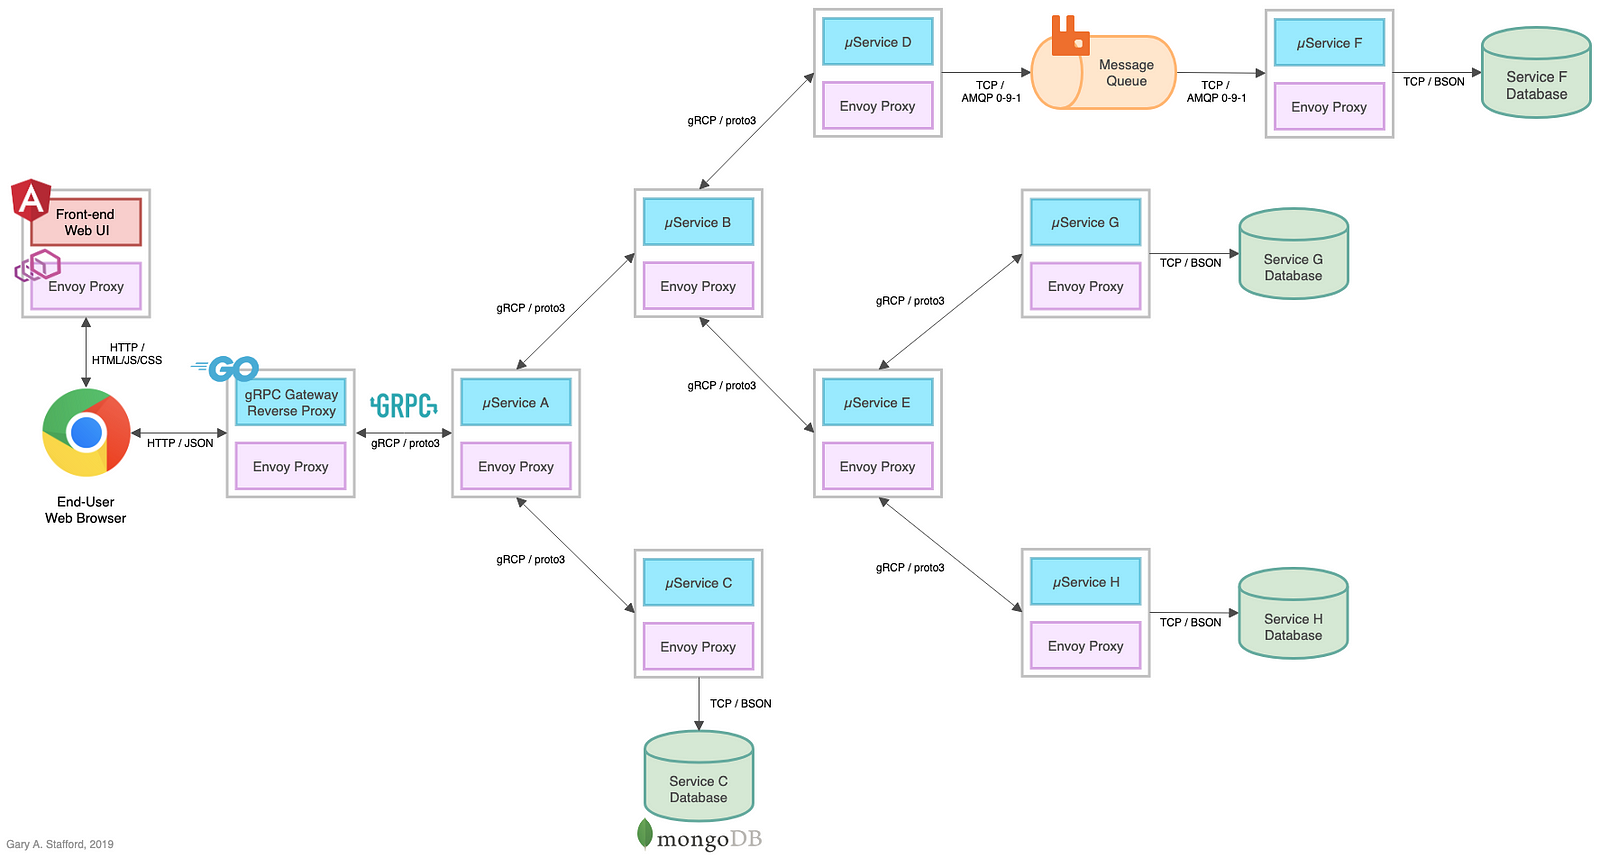
For this post, I have modified the eight Go microservices to use gRPC and Protocol Buffers, Google’s data interchange format. Specifically, the services use version 3 release (aka proto3) of Protocol Buffers. With gRPC, a gRPC client calls a gRPC server. Some of the platform’s services are gRPC servers, others are gRPC clients, while some act as both client and server, such as Service A, B, and E. The revised architecture is shown below.
gRPC Gateway
Assuming for the sake of this demonstration, that most consumers of the API would still expect to communicate using a RESTful JSON over HTTP API, I have added a gRPC Gateway reverse proxy to the platform. The gRPC Gateway is a gRPC to JSON reverse proxy, a common architectural pattern, which proxies communications between the JSON over HTTP-based clients and the gRPC-based microservices. A diagram from the grpc-gateway GitHub project site effectively demonstrates how the reverse proxy works.
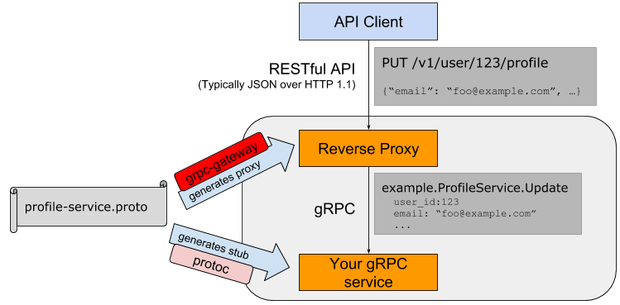
Image courtesy: https://github.com/grpc-ecosystem/grpc-gateway
In the revised platform architecture diagram above, note the addition of the reverse proxy, which replaces Service A at the edge of the API. The proxy sits between the Angular-based Web UI and Service A. Also, note the communication method between services is now Protobuf over gRPC instead of JSON over HTTP. The use of Envoy Proxy (via Istio) is unchanged, as is the MongoDB Atlas-based databases and CloudAMQP RabbitMQ-based queue, which are still external to the Kubernetes cluster.
Alternatives to gRPC Gateway
As an alternative to the gRPC Gateway reverse proxy, we could convert the TypeScript-based Angular UI client to gRPC and Protocol Buffers, and continue to communicate directly with Service A as the edge service. However, this would limit other consumers of the API to rely on gRPC as opposed to JSON over HTTP, unless we also chose to expose two different endpoints, gRPC, and JSON over HTTP, another common pattern.
Demonstration
In this post’s demonstration, we will repeat the same installation process, outlined in the previous post, Kubernetes-based Microservice Observability with Istio Service Mesh. We will deploy the revised gRPC-based platform to GKE on GCP. You could just as easily follow Azure Kubernetes Service (AKS) Observability with Istio Service Mesh, and deploy the platform to AKS.
Source Code
All source code for this post is available on GitHub, contained in three projects. The Go-based microservices source code, all Kubernetes resources, and all deployment scripts are located in the k8s-istio-observe-backend project repository, in the new grpc branch.
git clone
--branch grpc --single-branch
--depth 1 --no-tags
https://github.com/garystafford/k8s-istio-observe-backend.git
The Angular-based web client source code is located in the k8s-istio-observe-frontend repository on the new grpc branch. The source protocol buffers .proto file and the generated code, using the protocol buffers compiler, is located in the new pb-greeting project repository. You do not need to clone either of these projects for this post’s demonstration.
All Docker images for the services, UI, and the reverse proxy are located on Docker Hub.
Code Changes
This post is not specifically about writing Go for gRPC and Protobuf. However, to better understand the observability requirements and capabilities of these technologies, compared to JSON over HTTP, it is helpful to review some of the source code.
Microservices
First, compare the source code for Service A, shown below, to the original code in the previous post. The service’s code is almost completely re-written. I relied on several references for writing the code, including, Tracing gRPC with Istio, written by Neeraj Poddar of Aspen Mesh and Distributed Tracing Infrastructure with Jaeger on Kubernetes, by Masroor Hasan.
Specifically, note the following code changes to Service A:
- Import of the pb-greeting protobuf package;
- Local Greeting struct replaced with
pb.Greetingstruct; - All services are now hosted on port
50051; - The HTTP server and all API resource handler functions are removed;
- Headers, used for distributed tracing with Jaeger, have moved from HTTP request object to metadata passed in the gRPC context object;
- Service A is coded as a gRPC server, which is called by the gRPC Gateway reverse proxy (gRPC client) via the
Greetingfunction; - The primary
PingHandlerfunction, which returns the service’s Greeting, is replaced by the pb-greeting protobuf package’sGreetingfunction; - Service A is coded as a gRPC client, calling both Service B and Service C using the
CallGrpcServicefunction; - CORS handling is offloaded to Istio;
- Logging methods are unchanged;
Source code for revised gRPC-based Service A:
Greeting Protocol Buffers
Shown below is the greeting source protocol buffers .proto file. The greeting response struct, originally defined in the services, remains largely unchanged. The UI client responses will look identical.
When compiled with protoc, the Go-based protocol compiler plugin, the original 27 lines of source code swells to almost 270 lines of generated data access classes that are easier to use programmatically.
Below is a small snippet of that compiled code, for reference. The compiled code is included in the pb-greeting project on GitHub and imported into each microservice and the reverse proxy. We also compile a separate version for the reverse proxy to implement.
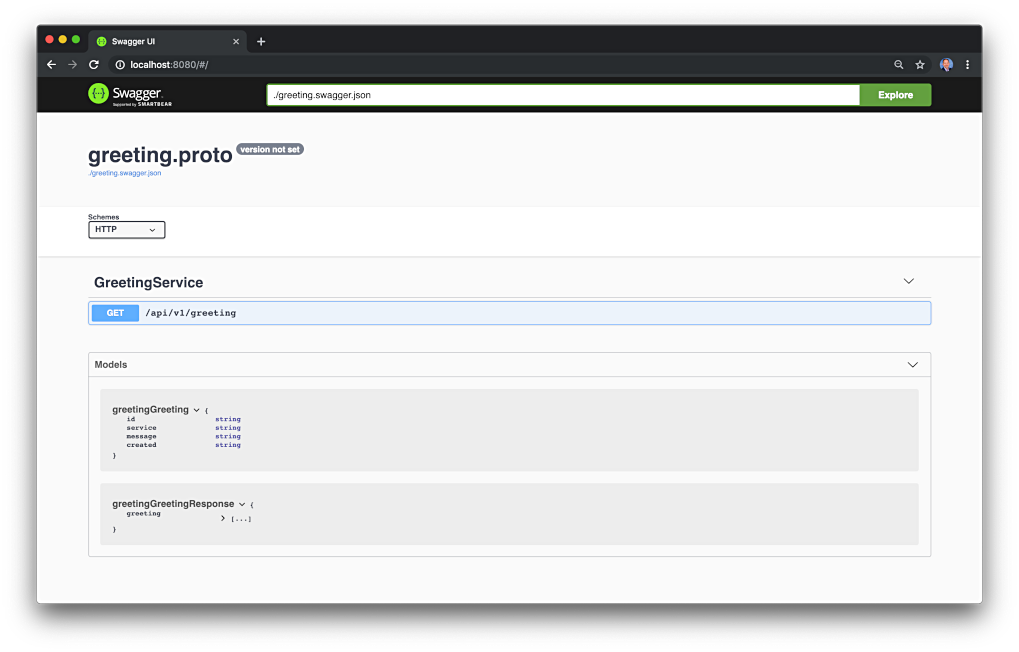
Using Swagger, we can view the greeting protocol buffers’ single RESTful API resource, exposed with an HTTP GET method. I use the Docker-based version of Swagger UI for viewing protoc generated swagger definitions.
docker run -p 8080:8080 -d --name swagger-ui
-e SWAGGER_JSON=/tmp/greeting.swagger.json
-v ${GOAPTH}/src/pb-greeting:/tmp swaggerapi/swagger-ui
The Angular UI makes an HTTP GET request to the /api/v1/greeting resource, which is transformed to gRPC and proxied to Service A, where it is handled by the Greeting function.
gRPC Gateway Reverse Proxy
As explained earlier, the gRPC Gateway reverse proxy service is completely new. Specifically, note the following code features in the gist below:
- Import of the pb-greeting protobuf package;
- The proxy is hosted on port
80; - Request headers, used for distributed tracing with Jaeger, are collected from the incoming HTTP request and passed to Service A in the gRPC context;
- The proxy is coded as a gRPC client, which calls Service A;
- Logging is largely unchanged;
The source code for the Reverse Proxy:
Header Propagation
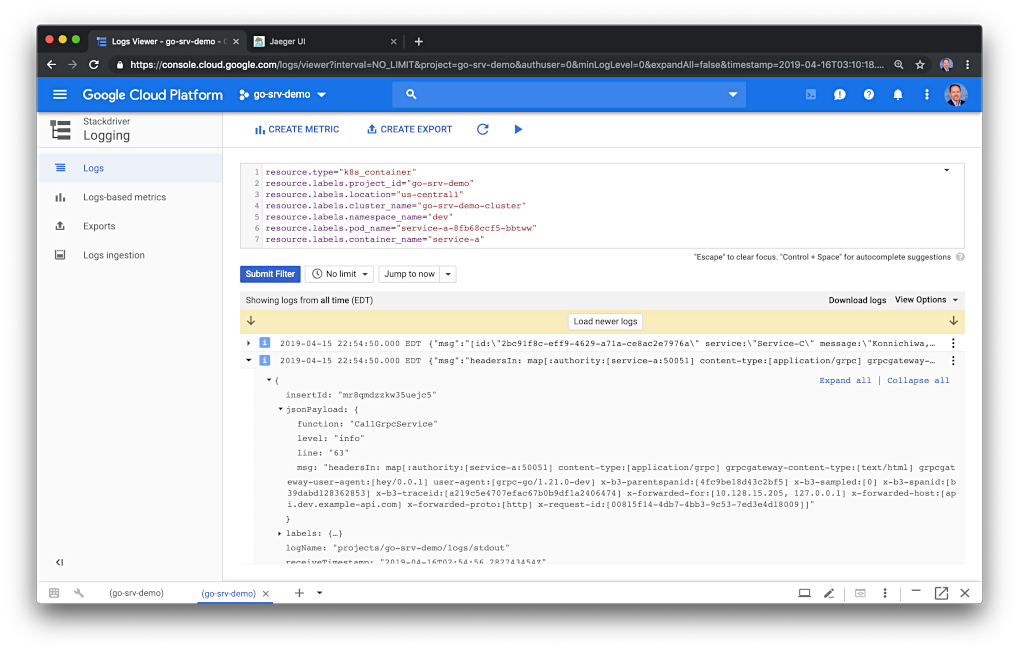
Below, in the Stackdriver logs, we see an example of a set of HTTP request headers in the JSON payload, which are propagated upstream to gRPC-based Go services from the gRPC Gateway’s reverse proxy. Header propagation ensures the request produces a complete distributed trace across the complete service call chain.
Istio VirtualService and CORS
According to feedback in the project’s GitHub Issues, the gRPC Gateway does not directly support Cross-Origin Resource Sharing (CORS) policy. In my own experience, the gRPC Gateway cannot handle OPTIONS HTTP method requests, which must be issued by the Angular 7 web UI. Therefore, I have offloaded CORS responsibility to Istio, using the VirtualService resource’s CorsPolicy configuration. This makes CORS much easier to manage than coding CORS configuration into service code.
Set-up and Installation
To deploy the microservices platform to GKE, follow the detailed instructions in part one of the post, Kubernetes-based Microservice Observability with Istio Service Mesh: Part 1, or Azure Kubernetes Service (AKS) Observability with Istio Service Mesh for AKS. You should also review the README document for this project, on GitHub.
- Create the external MongoDB Atlas database and CloudAMQP RabbitMQ clusters;
- Modify the Kubernetes resource files and bash scripts for your own environments;
- Create the managed GKE or AKS cluster on GCP or Azure;
- Configure and deploy Istio to the managed Kubernetes cluster, using Helm;
- Create DNS records for the platform’s exposed resources;
- Deploy the Go-based microservices, gRPC Gateway reverse proxy, Angular UI, and associated resources to Kubernetes cluster;
- Test and troubleshoot the platform deployment;
- Observe the results;
The Three Pillars
As introduced in the first post, logs, metrics, and traces are often known as the three pillars of observability. These are the external outputs of the system, which we may observe. As modern distributed systems grow ever more complex, the ability to observe those systems demands equally modern tooling that was designed with this level of complexity in mind. Traditional logging and monitoring systems often struggle with today’s hybrid and multi-cloud, polyglot language-based, event-driven, container-based and serverless, infinitely-scalable, ephemeral-compute platforms.
Tools like Istio Service Mesh attempt to solve the observability challenge by offering native integrations with several best-of-breed, open-source telemetry tools. Istio’s integrations include Jaeger for distributed tracing, Kiali for Istio service mesh-based microservice visualization and monitoring, and Prometheus and Grafana for metric collection, monitoring, and alerting. Combined with cloud platform-native monitoring and logging services, such as Stackdriver for GKE, CloudWatch for Amazon’s EKS, or Azure Monitor logs for AKS, and we have a complete observability solution for modern, distributed, Cloud-based applications.
Pillar 1: Logging
Moving from JSON over HTTP to gRPC does not require any changes to the logging configuration of the Go-based service code or Kubernetes resources.
Stackdriver with Logrus
As detailed in part two of the last post, Kubernetes-based Microservice Observability with Istio Service Mesh, our logging strategy for the eight Go-based microservices and the reverse proxy continues to be the use of Logrus, the popular structured logger for Go, and Banzai Cloud’s logrus-runtime-formatter.
If you recall, the Banzai formatter automatically tags log messages with runtime/stack information, including function name and line number; extremely helpful when troubleshooting. We are also using Logrus’ JSON formatter. Below, in the Stackdriver console, note how each log entry below has the JSON payload contained within the message with the log level, function name, lines on which the log entry originated, and the message.

Below, we see the details of a specific log entry’s JSON payload. In this case, we can see the request headers propagated from the downstream service.
Pillar 2: Metrics
Moving from JSON over HTTP to gRPC does not require any changes to the metrics configuration of the Go-based service code or Kubernetes resources.
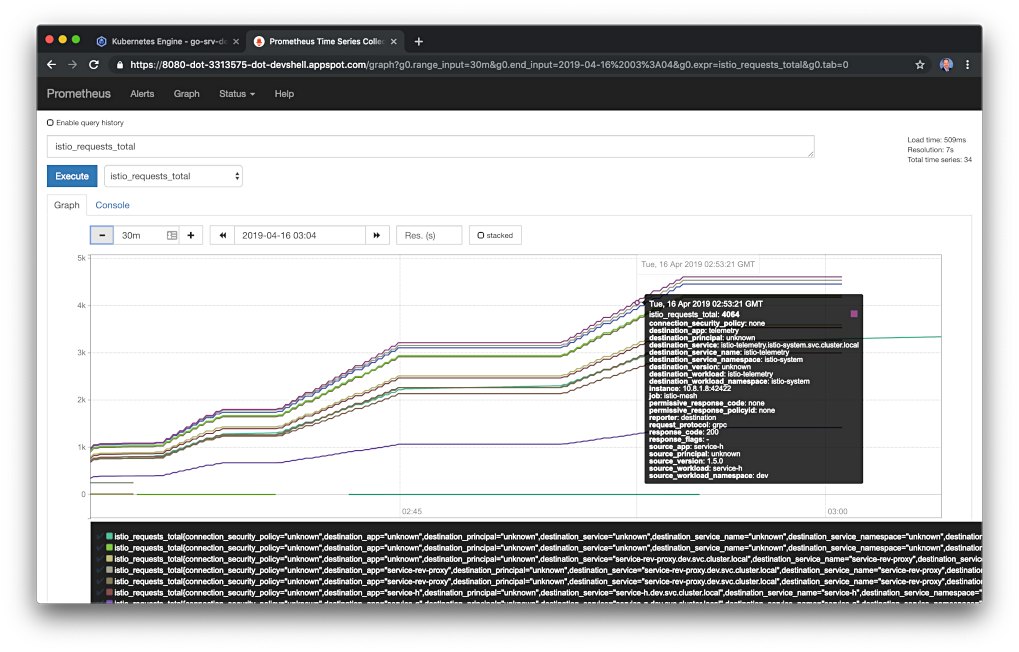
Prometheus
Prometheus is a completely open source and community-driven systems monitoring and alerting toolkit originally built at SoundCloud, circa 2012. Interestingly, Prometheus joined the Cloud Native Computing Foundation (CNCF) in 2016 as the second hosted-project, after Kubernetes.
Grafana
Grafana describes itself as the leading open source software for time series analytics. According to Grafana Labs, Grafana allows you to query, visualize, alert on, and understand your metrics no matter where they are stored. You can easily create, explore, and share visually-rich, data-driven dashboards. Grafana allows users to visually define alert rules for your most important metrics. Grafana will continuously evaluate rules and can send notifications.
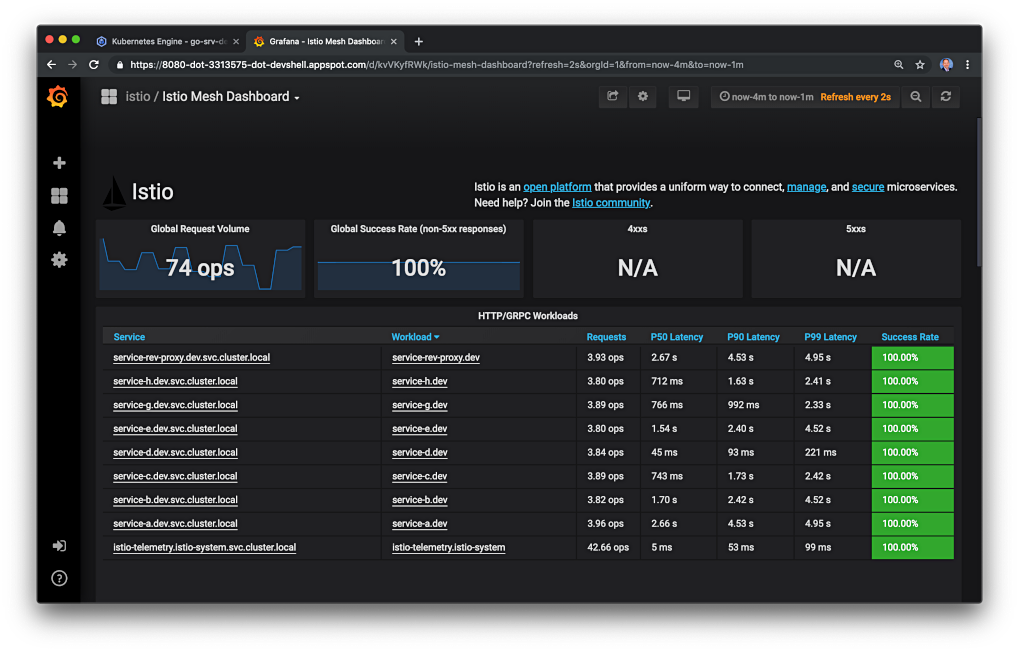
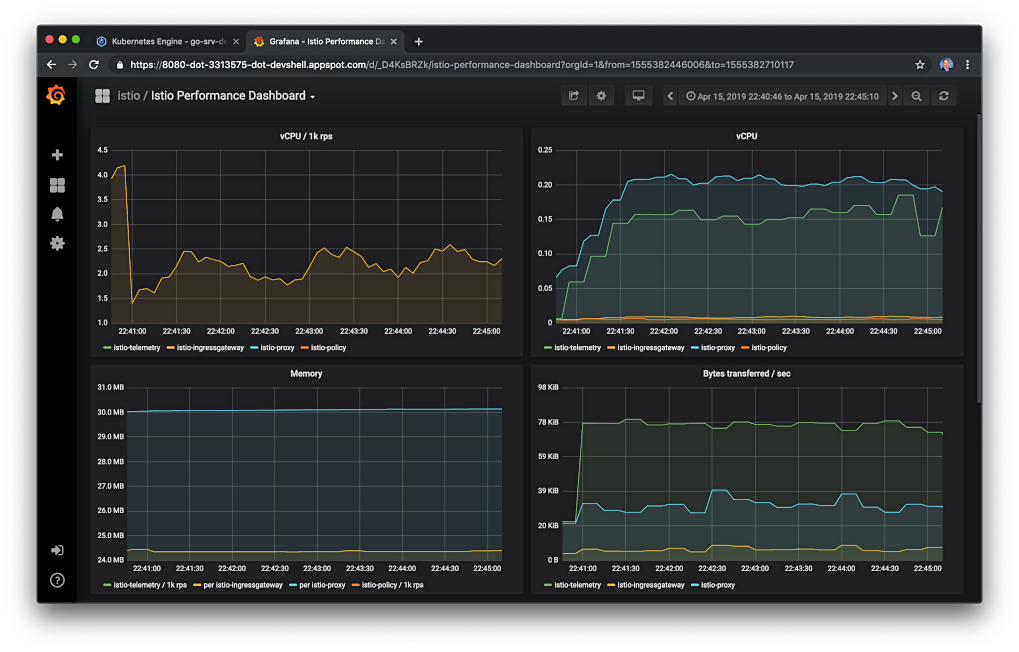
According to Istio, the Grafana add-on is a pre-configured instance of Grafana. The Grafana Docker base image has been modified to start with both a Prometheus data source and the Istio Dashboard installed. Below, we see two of the pre-configured dashboards, the Istio Mesh Dashboard and the Istio Performance Dashboard.
Pillar 3: Traces
Moving from JSON over HTTP to gRPC did require a complete re-write of the tracing logic in the service code. In fact, I spent the majority of my time ensuring the correct headers were propagated from the Istio Ingress Gateway to the gRPC Gateway reverse proxy, to Service A in the gRPC context, and upstream to all the dependent, gRPC-based services. I am sure there are a number of optimization in my current code, regarding the correct handling of traces and how this information is propagated across the service call stack.
Jaeger
According to their website, Jaeger, inspired by Dapper and OpenZipkin, is a distributed tracing system released as open source by Uber Technologies. It is used for monitoring and troubleshooting microservices-based distributed systems, including distributed context propagation, distributed transaction monitoring, root cause analysis, service dependency analysis, and performance and latency optimization. The Jaeger website contains an excellent overview of Jaeger’s architecture and general tracing-related terminology.
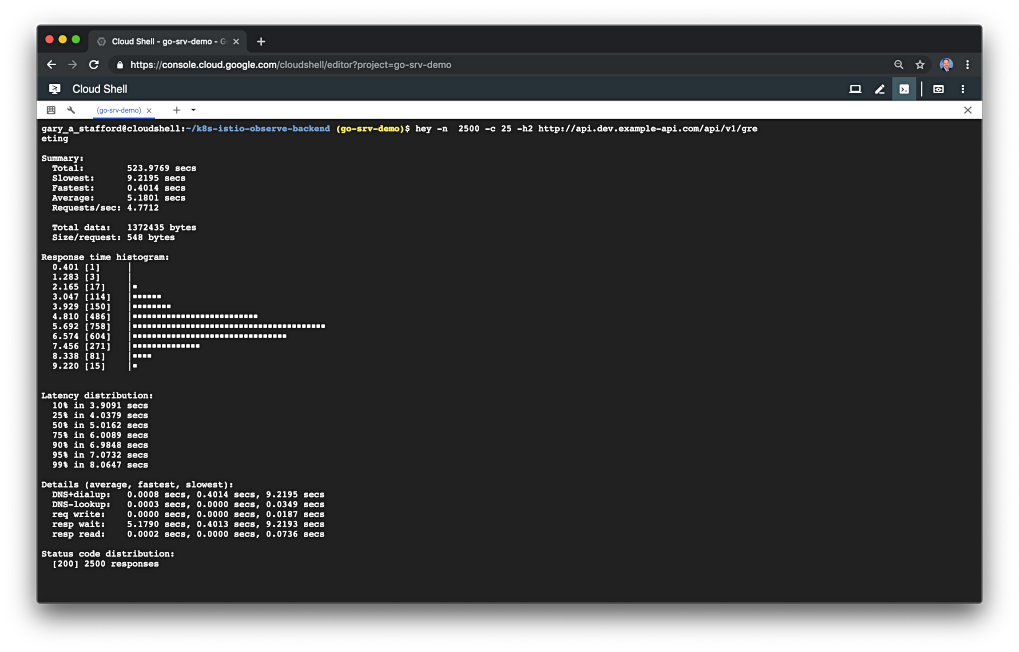
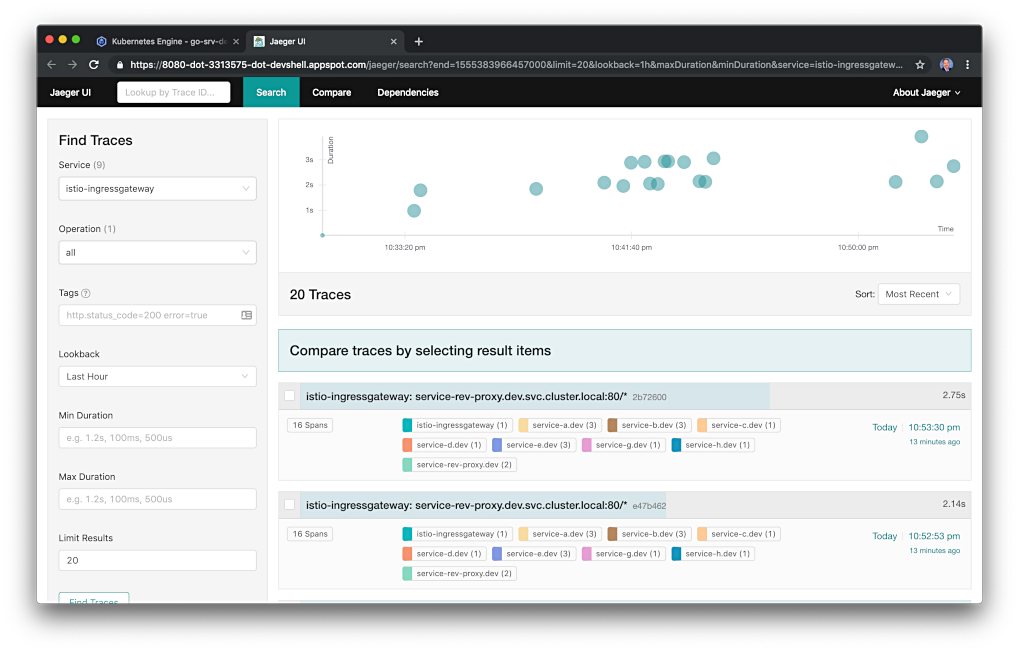
Below we see the Jaeger UI Traces View. In it, we see a series of traces generated by hey, a modern load generator and benchmarking tool, and a worthy replacement for Apache Bench ( ab). Unlike ab, hey supports HTTP/2. The use of hey was detailed in the previous post.
A trace, as you might recall, is an execution path through the system and can be thought of as a directed acyclic graph (DAG) of spans. If you have worked with systems like Apache Spark, you are probably already familiar with DAGs.
Below we see the Jaeger UI Trace Detail View. The example trace contains 16 spans, which encompasses nine components — seven of the eight Go-based services, the reverse proxy, and the Istio Ingress Gateway. The trace and the spans each have timings. The root span in the trace is the Istio Ingress Gateway. In this demo, traces do not span the RabbitMQ message queues. This means you would not see a trace which includes the decoupled, message-based communications between Service D to Service F, via the RabbitMQ.

Within the Jaeger UI Trace Detail View, you also have the ability to drill into a single span, which contains additional metadata. Metadata includes the URL being called, HTTP method, response status, and several other headers.

Microservice Observability
Moving from JSON over HTTP to gRPC does not require any changes to the Kiali configuration of the Go-based service code or Kubernetes resources.
Kiali
According to their website, Kiali provides answers to the questions: What are the microservices in my Istio service mesh, and how are they connected? Kiali works with Istio, in OpenShift or Kubernetes, to visualize the service mesh topology, to provide visibility into features like circuit breakers, request rates and more. It offers insights about the mesh components at different levels, from abstract Applications to Services and Workloads.
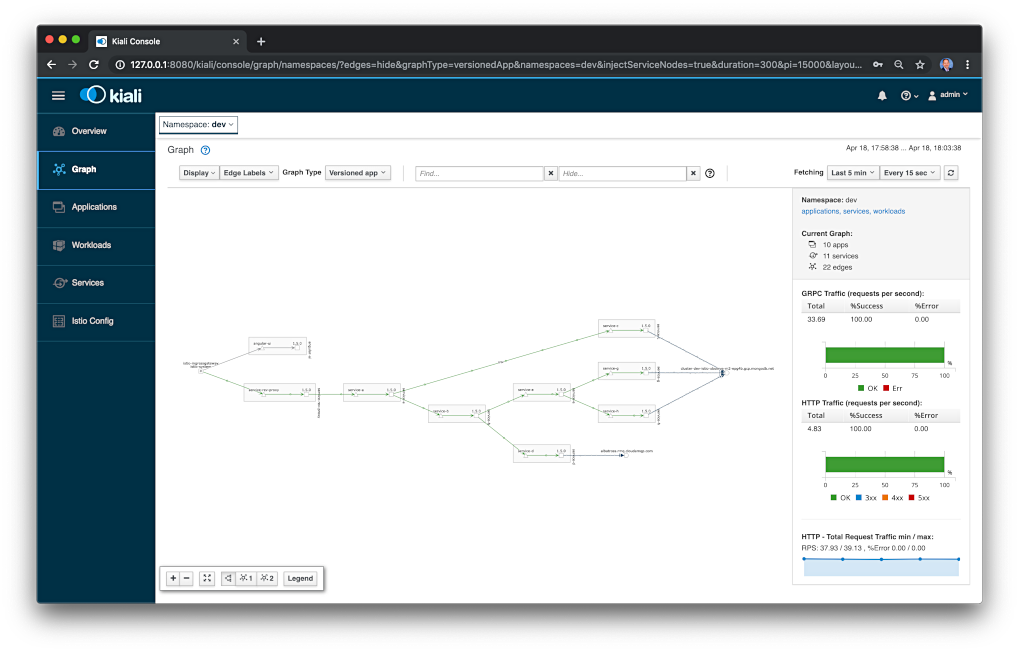
The Graph View in the Kiali UI is a visual representation of the components running in the Istio service mesh. Below, filtering on the cluster’s dev Namespace, we should observe that Kiali has mapped all components in the platform, along with rich metadata, such as their version and communication protocols.
Using Kiali, we can confirm our service-to-service IPC protocol is now gRPC instead of the previous HTTP.

Although converting from JSON over HTTP to protocol buffers with gRPC required major code changes to the services, it did not impact the high-level observability we have of those services using the tools provided by Istio, including Prometheus, Grafana, Jaeger, and Kiali.
All opinions expressed in this post are my own and not necessarily the views of my current or past employers or their clients.
