Most of my readers will understand that cache is a fast but small type of memory that stores recently accessed memory locations. This description is reasonably accurate, but the “boring” details of how processor caches work can help a lot when trying to understand program performance.
In this blog post, I will use code samples to illustrate various aspects of how caches work, and what is the impact on the performance of real-world programs.
The examples are in C#, but the language choice has little impact on the performance scores and the conclusions they lead to.
Example 1: Memory accesses and performance
How much faster do you expect Loop 2 to run, compared Loop 1?
int[] arr = new int[64 * 1024 * 1024];

// Loop 1
for (int i = 0; i < arr.Length; i++) arr[i] *= 3;

// Loop 2
for (int i = 0; i < arr.Length; i += 16) arr[i] *= 3;
The first loop multiplies every value in the array by 3, and the second loop multiplies only every 16-th. The second loop only does about 6% of the work of the first loop, but on modern machines, the two for-loops take about the same time: 80 and 78 ms respectively on my machine.
The reason why the loops take the same amount of time has to do with memory. The running time of these loops is dominated by the memory accesses to the array, not by the integer multiplications. And, as I’ll explain on Example 2, the hardware will perform the same main memory accesses for the two loops.
Example 2: Impact of cache lines
Let’s explore this example deeper. We will try other step values, not just 1 and 16:
for (int i = 0; i < arr.Length; i += K) arr[i] *= 3;
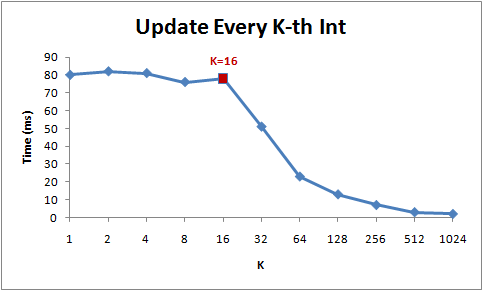
Here are the running times of this loop for different step values (K):

Notice that while step is in the range from 1 to 16, the running time of the for-loop hardly changes. But from 16 onwards, the running time is halved each time we double the step.
The reason behind this is that today’s CPUs do not access memory byte by byte. Instead, they fetch memory in chunks of (typically) 64 bytes, called cache lines. When you read a particular memory location, the entire cache line is fetched from the main memory into the cache. And, accessing other values from the same cache line is cheap!
Since 16 ints take up 64 bytes (one cache line), for-loops with a step between 1 and 16 have to touch the same number of cache lines: all of the cache lines in the array. But once the step is 32, we’ll only touch roughly every other cache line, and once it is 64, only every fourth.
Understanding of cache lines can be important for certain types of program optimizations. For example, alignment of data may determine whether an operation touches one or two cache lines. As we saw in the example above, this can easily mean that in the misaligned case, the operation will be twice slower.
Example 3: L1 and L2 cache sizes
Today’s computers come with two or three levels of caches, usually called L1, L2 and possibly L3. If you want to know the sizes of the different caches, you can use the CoreInfo SysInternals tool, or use the GetLogicalProcessorInfo Windows API call. Both methods will also tell you the cache line sizes, in addition to the cache sizes.
On my machine, CoreInfo reports that I have a 32kB L1 data cache, a 32kB L1 instruction cache, and a 4MB L2 data cache. The L1 caches are per-core, and the L2 caches are shared between pairs of cores:
Logical Processor to Cache Map:
*---  Data Cache          0, Level 1,   32 KB, Assoc   8, LineSize  64
*---  Instruction Cache   0, Level 1,   32 KB, Assoc   8, LineSize  64
-*--  Data Cache          1, Level 1,   32 KB, Assoc   8, LineSize  64
-*--  Instruction Cache   1, Level 1,   32 KB, Assoc   8, LineSize  64
**--  Unified Cache       0, Level 2,    4 MB, Assoc  16, LineSize  64
--*-  Data Cache          2, Level 1,   32 KB, Assoc   8, LineSize  64
--*-  Instruction Cache   2, Level 1,   32 KB, Assoc   8, LineSize  64
---*  Data Cache          3, Level 1,   32 KB, Assoc   8, LineSize  64
---*  Instruction Cache   3, Level 1,   32 KB, Assoc   8, LineSize  64
--**  Unified Cache       1, Level 2,    4 MB, Assoc  16, LineSize  64
Let’s verify these numbers by an experiment. To do that, we’ll step over an array incrementing every 16th integer – a cheap way to modify every cache line. When we reach the last value, we loop back to the beginning. We’ll experiment with different array sizes, and we should see drops in the performance at the array sizes where the array spills out of one cache level.
Here is the program:
int steps = 64 * 1024 * 1024; // Arbitrary number of steps
int lengthMod = arr.Length - 1;
for (int i = 0; i < steps; i++)
{
    arr[(i * 16) & lengthMod]++; // (x & lengthMod) is equal to (x % arr.Length)
}
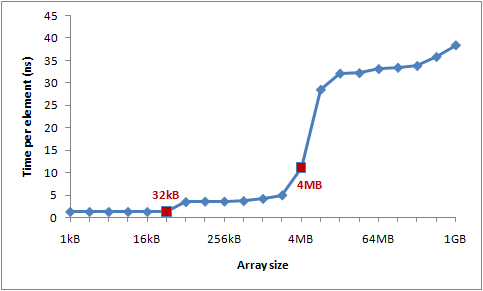
And here are the timings:

You can see distinct drops after 32kB and 4MB – the sizes of L1 and L2 caches on my machine.
Example 4: Instruction-level parallelism
Now, let’s take a look at something different. Out of these two loops, which one would you expect to be faster?
int steps = 256 * 1024 * 1024;
int[] a = new int[2];

// Loop 1
for (int i=0; i<steps; i++) { a[0]++; a[0]++; }

// Loop 2
for (int i=0; i<steps; i++) { a[0]++; a[1]++; }
It turns out that the second loop is about twice faster than the first loop, at least on all of the machines I tested. Why? This has to do with the dependencies between operations in the two loop bodies.
In the body of the first loop, operations depend on each other as follows:
![]()
But in the second example, we only have these dependencies:

The modern processor has various parts that have a little bit of parallelism in them: it can access two memory locations in L1 at the same time, or perform two simple arithmetic operations. In the first loop, the processor cannot exploit this instruction-level parallelism, but in the second loop, it can.
[UPDATE]: Many people on reddit are asking about compiler optimizations, and whether { a[0]++; a[0]++; } would just get optimized to { a[0]+=2; }. In fact, the C# compiler and CLR JIT will not do this optimization – not when array accesses are involved. I built all of the tests in release mode (i.e. with optimizations), but I looked at the JIT-ted assembly to verify that optimizations aren’t skewing the results.
Example 5: Cache associativity
One key decision in cache design is whether each chunk of main memory can be stored in any cache slot, or in just some of them.
There are three possible approaches to mapping cache slots to memory chunks:
-
Direct mapped cache
Each memory chunk can only be stored only in one particular slot in the cache. One simple solution is to map the chunk with index chunk_index to cache slot (chunk_index % cache_slots). Two memory chunks that map to the same slot cannot be stored simultaneously in the cache.
-
N-way set associative cache
Each memory chunk can be stored in any one of N particular slots in the cache. As an example, in a 16-way cache, each memory chunk can be stored in 16 different cache slots. Commonly, chunks with indices with the same lowest order bits will all share 16 slots.
-
Fully associative cache
Each memory chunk can be stored in any slot in the cache. Effectively, the cache operates like a hash table.
Direct mapped caches can suffer from conflicts – when multiple values compete for the same slot in the cache, they keep evicting each other out, and the hit rate plummets. On the other hand, fully associative caches are complicated and costly to implement in the hardware. N-way set associative caches are the typical solution for processor caches, as they make a good trade off between implementation simplicity and good hit rate.
For example, the 4MB L2 cache on my machine is 16-way associative. All 64-byte memory chunks are partitioned into sets (based on the lowest order bits of the chunk index), and chunks in the same set compete for 16 slots in the L2 cache.
Since the L2 cache has 65,536 slots, and each set will need 16 slots in the cache, we will have 4,096 sets. So, the lowest 12 bits of the chunk index will determine which set the chunk belongs to (212 = 4,096). As a result, cache lines at addresses that differ by a multiple of 262,144 bytes (4096 * 64) will compete for the same slot in the cache. The cache on my machine can hold at most 16 such cache lines.
In order for the effects of cache associativity to become apparent, I need to repeatedly access more than 16 elements from the same set. I will demonstrate this using the following method:
public static long UpdateEveryKthByte(byte[] arr, int K)
{
    Stopwatch sw = Stopwatch.StartNew();
    const int rep = 1024*1024; // Number of iterations – arbitrary

    int p = 0;
    for (int i = 0; i < rep; i++)
    {
        arr[p]++;
        p += K;
        if (p >= arr.Length) p = 0;
    }

    sw.Stop();
    return sw.ElapsedMilliseconds;
}
This method increments every K-th value in the array. Once the it reaches the end of the array, it starts again from the beginning. After running sufficiently long (2^20 steps), the loop stops.
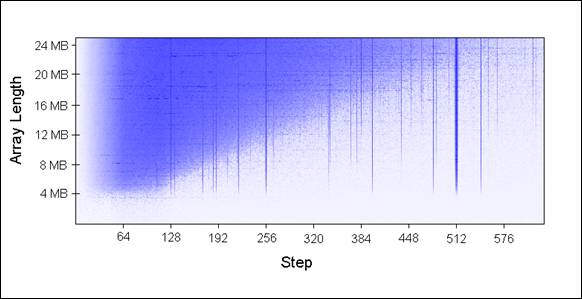
I ran UpdateEveryKthByte() with different array sizes (in 1MB increments) and different step sizes. Here is a plot of the results, with blue representing long running time, and white representing short:
The blue areas (long running times) are cases where the updated values could not be simultaneously held in the cache as we repeatedly iterated over them. The bright blue areas correspond to running times of ~80 ms, and the nearly white areas to ~10 ms.
Let’s explain the blue parts of the chart:
-
Why the vertical lines?The vertical lines show the step values that touch too many memory locations (>16) from the same set. For those steps, we cannot simultaneously hold all touched values in the 16-way associative cache on my machine.
Some bad step values are powers of two: 256 and 512. As an example, consider step 512 on an 8MB array. An 8MB cache line contains 32 values that are spaced by 262,144 bytes apart. All of those values will be updated by each pass of our loop, because 512 divides 262,144.
And since 32 > 16, those 32 values will keep competing for the same 16 slots in the cache.
Some values that are not powers of two are simply unfortunate, and will end up visiting disproportionately many values from the same set. Those step values will also show up as as blue lines.
-
Why do the vertical lines stop at 4MB array length?On arrays of 4MB or less, a 16-way associative cache is just as good as a fully associative one.
A 16-way associative cache can hold at most 16 cache lines that are a multiple of 262,144 bytes apart. There is no set of 17 or more cache lines all aligned on 262,144-byte boundaries within 4MB, because 16 * 262,144 = 4,194,304.
-
Why the blue triangle in upper left?In the triangle area, we cannot hold all necessary data in cache simultaneously … not due to the associativity, but simply because of the L2 cache size limit.
For example, consider the array length 16MB with step 128. We are repeatedly updating every 128th byte in the array, which means that we touch every other 64-byte memory chunk. To store every other cache line of a 16MB array, we’d need 8MB cache. But, my machine only has 4MB of cache.
Even if the 4MB cache on my machine was fully associative, it still wouldn’t be able to hold 8MB of data.
-
Why does the triangle fade out in the left?Notice that the gradient goes from 0 to 64 bytes – one cache line! As explained in examples 1 and 2, additional accesses to same cache line are nearly free. For example, when stepping by 16 bytes, it will take 4 steps to get to the next cache line. So, we get four memory accesses for the price of one.
Since the number of steps is the same for all cases, a cheaper step results in a shorter running time.
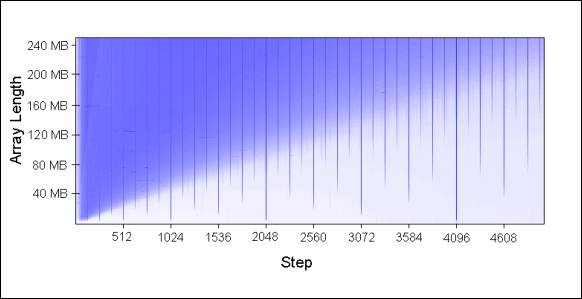
These patterns continue to hold as you extend the chart:
Cache associativity is interesting to understand and can certainly be demonstrated, but it tends to be less of a problem compared to the other issues discussed in this article. It is certainly not something that should be at the forefront of your mind as you write programs.
Example 6: False cache line sharing
On multi-core machines, caches encounter another problem – consistency. Different cores have fully or partly separate caches. On my machine, L1 caches are separate (as is common), and there are two pairs of processors, each pair sharing an L2 cache. While the details vary, a modern multi-core machine will have a multi-level cache hierarchy, where the faster and smaller caches belong to individual processors.
When one processor modifies a value in its cache, other processors cannot use the old value anymore. That memory location will be invalidated in all of the caches. Furthermore, since caches operate on the granularity of cache lines and not individual bytes, the entire cache line will be invalidated in all caches!
To demonstrate this issue, consider this example:
private static int[] s_counter = new int[1024];
private void UpdateCounter(int position)
{
    for (int j = 0; j < 100000000; j++)
    {
        s_counter[position] = s_counter[position] + 3;
    }
}
On my quad-core machine, if I call UpdateCounter with parameters 0,1,2,3 from four different threads, it will take 4.3 seconds until all threads are done.
On the other hand, if I call UpdateCounter with parameters 16,32,48,64 the operation will be done in 0.28 seconds!
Why? In the first case, all four values are very likely to end up on the same cache line. Each time a core increments the counter, it invalidates the cache line that holds all four counters. All other cores will suffer a cache miss the next time they access their own counters. This kind of thread behavior effectively disables caches, crippling the program’s performance.
Example 7: Hardware complexities
Even when you know the basics of how caches work, the hardware will still sometimes surprise you. Different processors differ in optimizations, heuristics, and subtle details of how they do things.
On some processors, L1 cache can process two accesses in parallel if they access cache lines from different banks, and serially if they belong to the same bank. Also, processors can surprise you with clever optimizations. For example, the false-sharing example that I’ve used on several machines in the past did not work well on my machine without tweaks – my home machine can optimize the execution in the simplest cases to reduce the cache invalidations.
Here is one odd example of “hardware weirdness”:
private static int A, B, C, D, E, F, G;
private static void Weirdness()
{
    for (int i = 0; i < 200000000; i++)
    {
        <something>
    }
}
When I substitute three different blocks for “<something>”, I get these timings:
| <something> | Time |
| A++; B++; C++; D++; | 719 ms |
| A++; C++; E++; G++; | 448 ms |
| A++; C++; | 518 ms |
Incrementing fields A,B,C,D takes longer than incrementing fields A,C,E,G. And what’s even weirder, incrementing just A and C takes longer than increment A and C and E and G!
I don’t know for sure what is the reason behind these numbers, but I suspect it is related to memory banks. If someone can explain these numbers, I’d be very curious to hear about it.
The lesson of this example is that can be difficult to fully predict hardware performance. There is a lot that you can predict, but ultimately, it is very important to measure and verify your assumptions.
Conclusion
Hopefully all of this helps you understand how caches work, and apply that knowledge when tuning your programs.


